The end user's selection of filter criteria determines the output of a SAP report. A SAP report is a program used to access and analyse data from the database.
In order to run any SAP report, the following components must be configured.
Select a Period
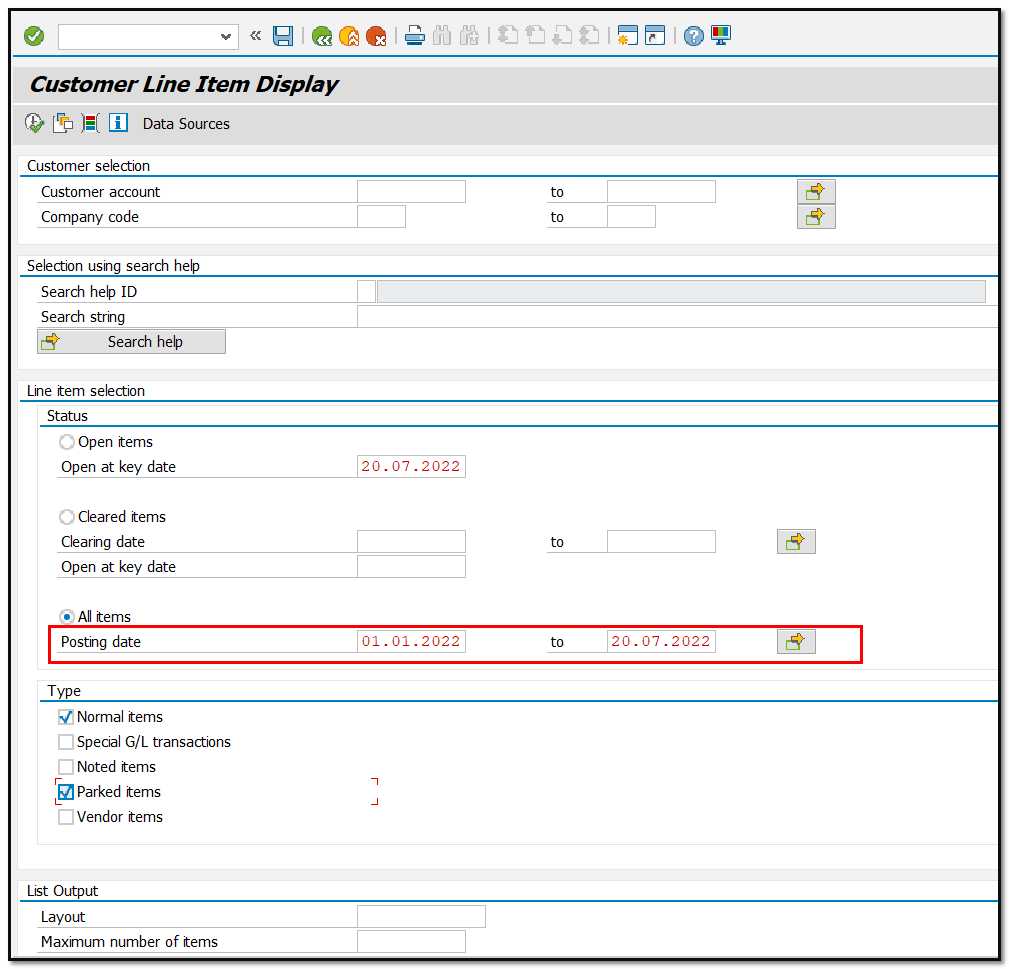
Figure 1 Report Selection Screen - Period
You can adjust the timeframe of the report by selecting different From and To dates.
Restrict the output
You can limit the results of your report by entering the specified criteria from below.
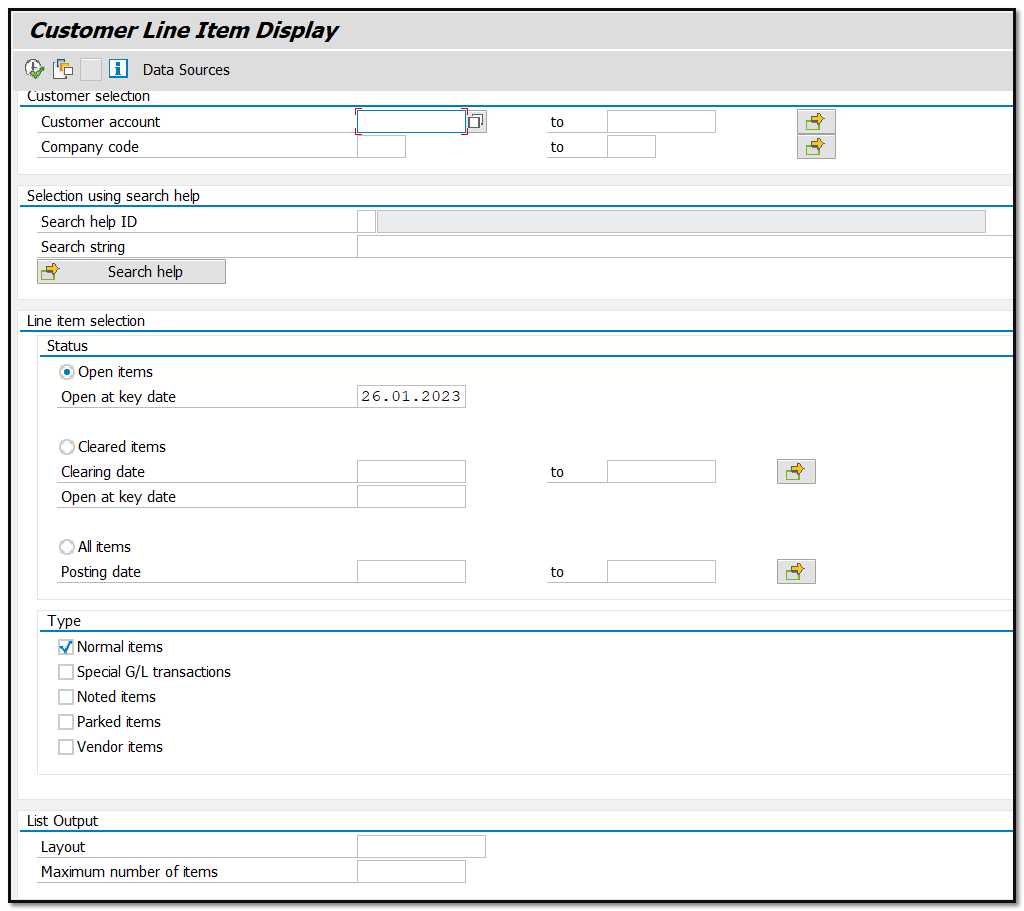
Figure 2 Report Selection Screen – Restricting the output
Dynamic Selection
Reports with Dynamic selection enable you to add additional fields for specifying search criteria. Choose the Dynamic selection icon, as seen in the image below.

Figure 3 Report Selection Screen – Dynamic Selection.
Select which fields you'd like to appear in the report's selection menu. Then use the arrow key or double-click your mouse to move it to the right.
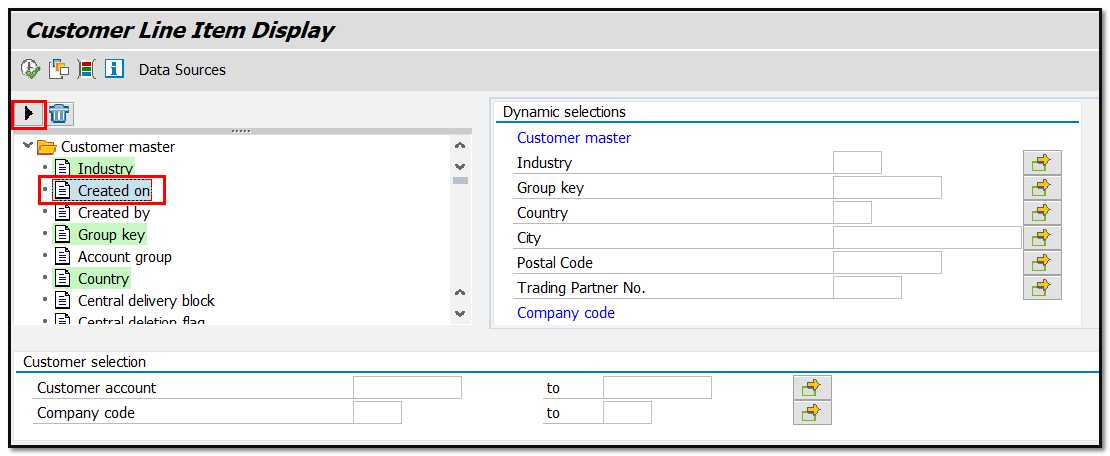
Figure 4 Report Selection Screen – Dynamic Selection Details
The list of selection fields will now show the selection field.
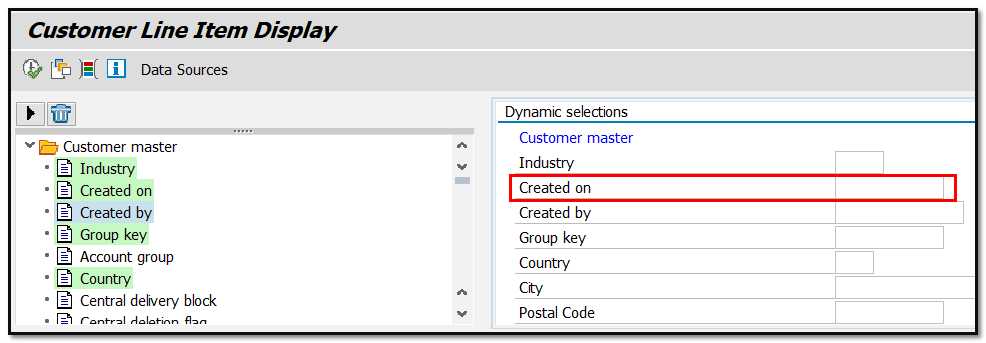
Figure 5 Report Selection Screen – Dynamic Selection – Entry added
Specifying Selection Criteria on the Input Screen
Both individual values and ranges of values can be utilized in your report. To select multiple items, click the button on the right side.

Figure 6 Report Selection Screen – Adding ranges of values
You can select single values or data range as well as exclude them by choosing appropriate tab.
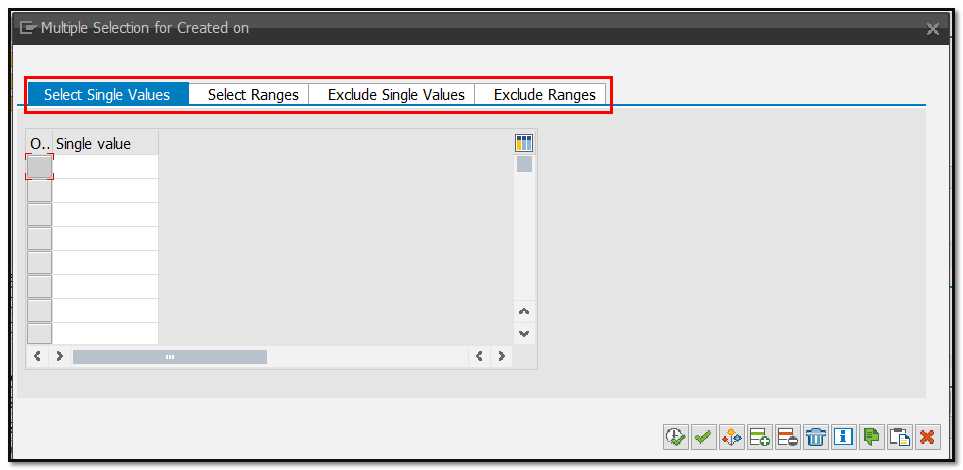
Figure 7 Report Selection Screen – Multiple Selection
By utilizing selection options, you can further restrict the criteria (e.g., not equal to, less than, etc).
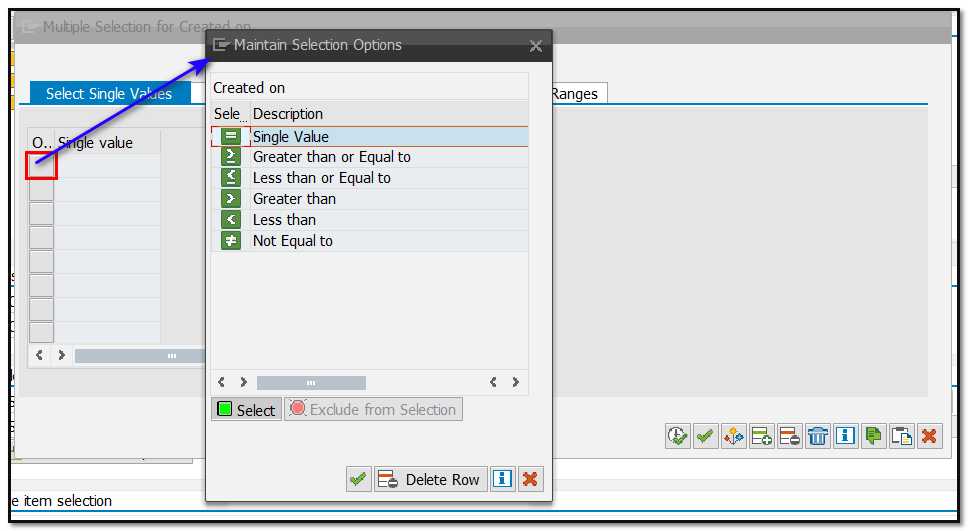
Figure 8 Report Selection Screen – Selection Options
You can paste your data using CTRL V if you have less entries, for larger selection use the button “Copy from Clipboard”, as shown below:
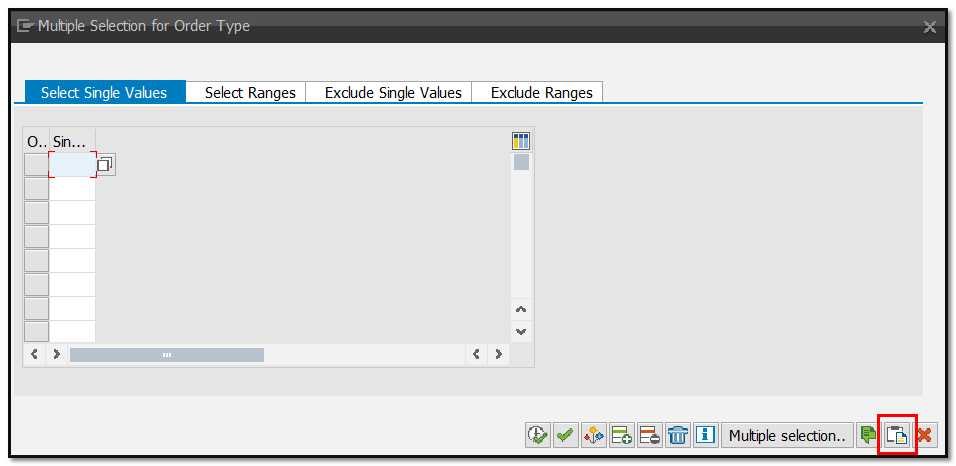
Figure 9 Report Selection Screen – Multiple Selection – Pasting data
SAP Report Output Format
The toolbar below allows you to quickly customize the layout of your report results (e.g. sorting, summarizing, filtering, exporting the data, etc.).
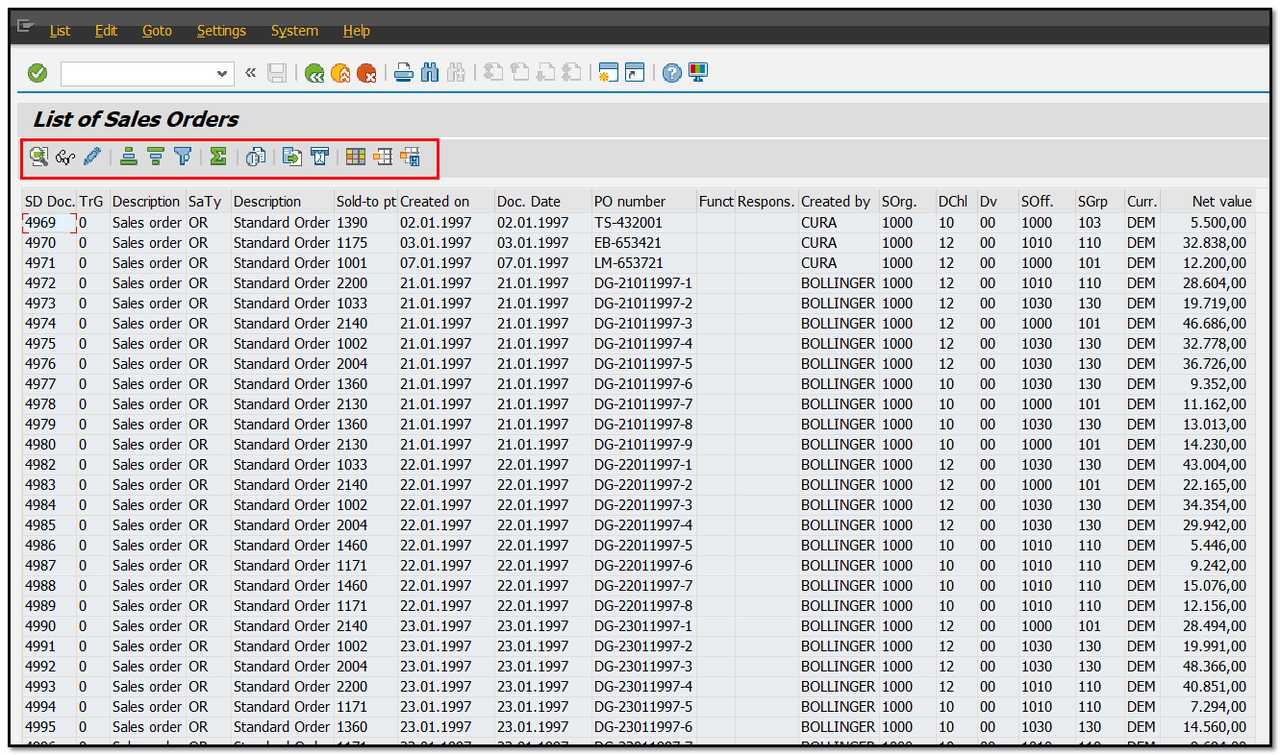
Figure 10 Report Output Format
In the reports you can save the layouts based on your needs. Choose the “Maintain Report Layout” icon from the top menu. A window will appear where you can change the displayed columns, sort or setup a filter for particular column. To move the line from left to right or right to left, position the cursor on the field and double click on it or use the arrow key.
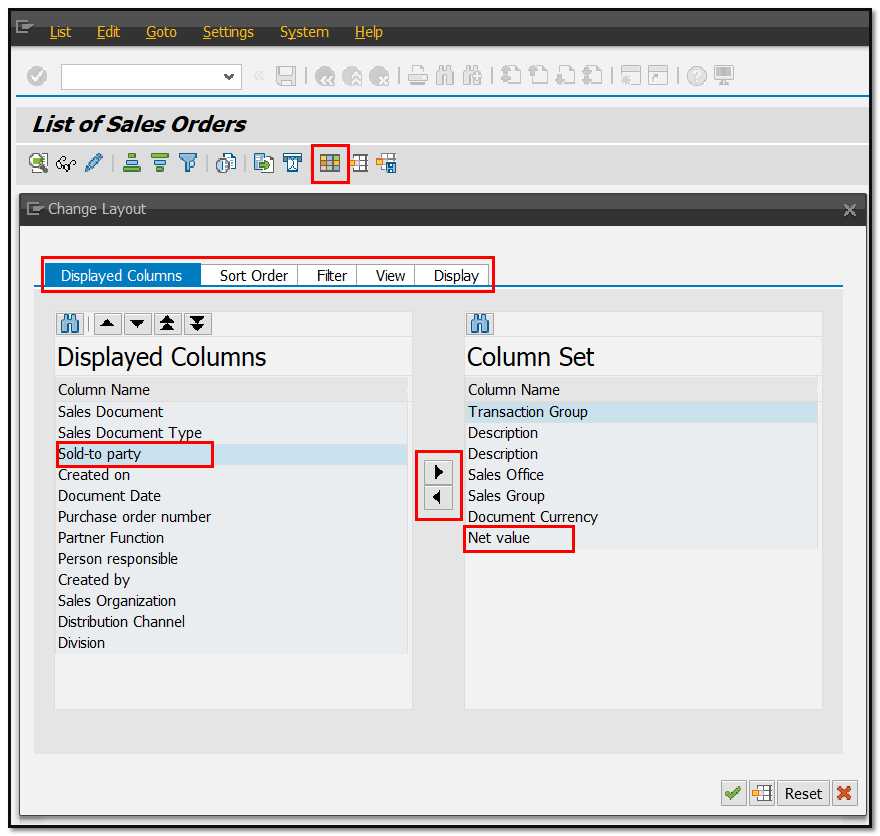
Figure 11 Report Output – Changing Layout
Once the changes are completed click on “Adopt” button or press enter.
To save the layout click on icon as shown below, enter the layout and its name, if required set the layout as default or user specific and save.
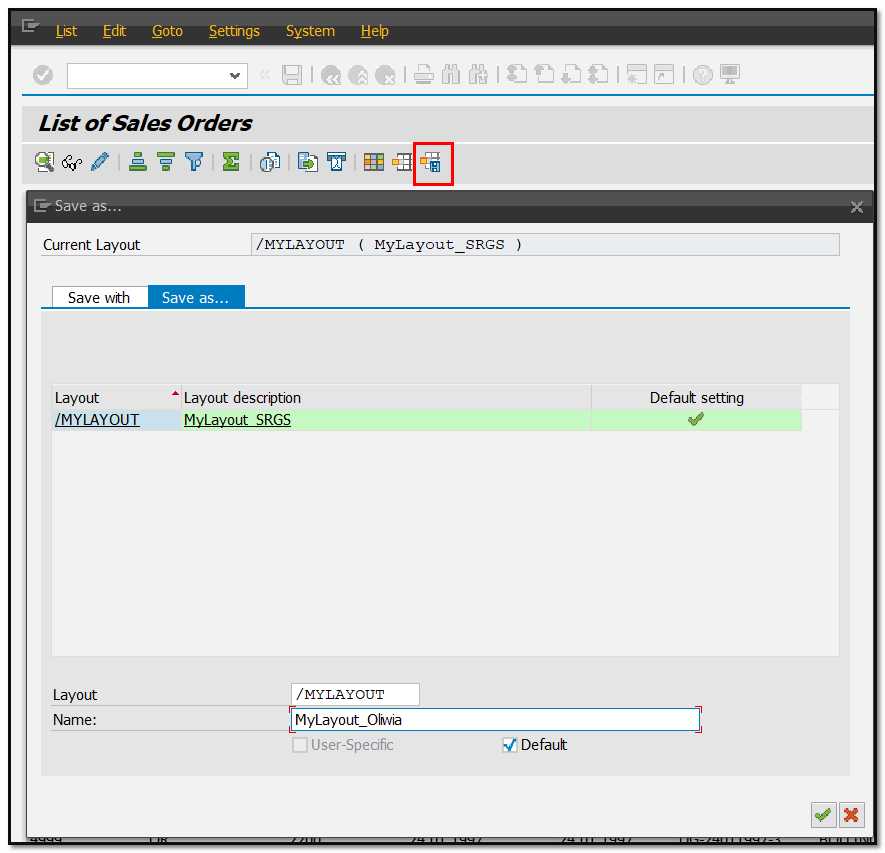
Figure 12 Report Output – Saving Layout
Quick Cut and Paste
To activate this functionality, from the top menu choose “Customize Local Layout” icon and click on “Quick Cut and Paste”.
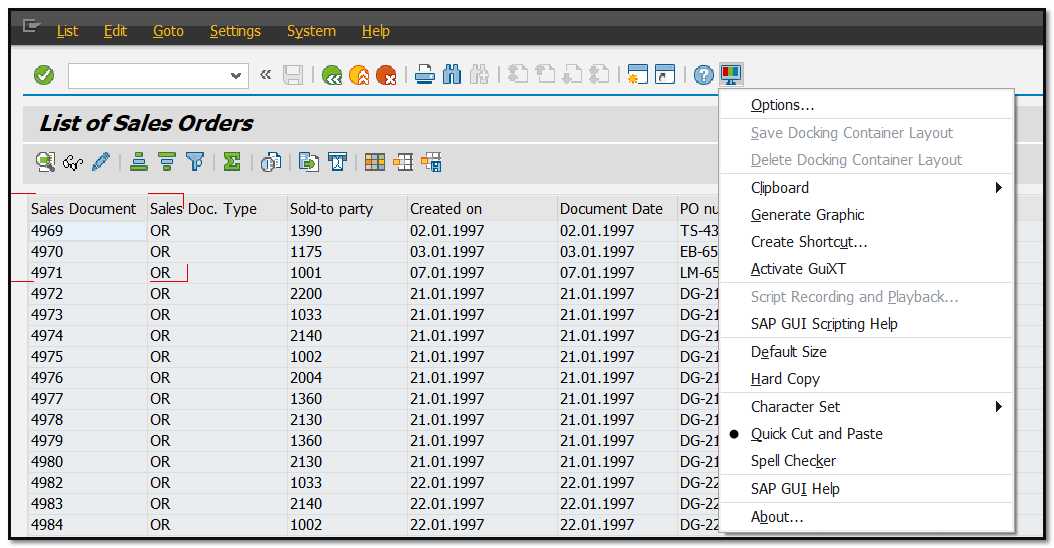
Now to select and copy data from the report, press CTRL + Y. The cursor will change and it will allow you to mark a section on the display and copy it to the clipboard.
Figure 13 shows fields selected using the Ctrl+Y function, all are highlighted in black.
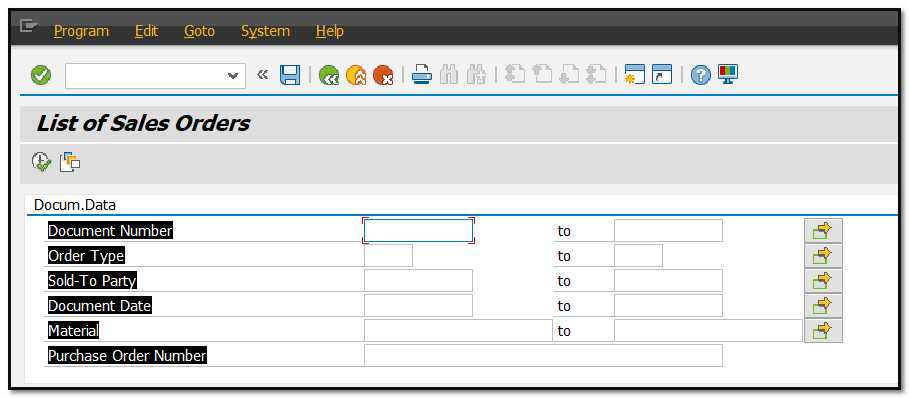
Figure 13 Report Output – Selecting Data
Freeze Columns
You can freeze columns on SAP reports, just like MS Excel. Select the columns and from the top menu choose Settings – Columns - Freeze to Column. Selected column will be frozen, like Freeze Pane in Excel. You can also achieve it by right clicking on the column and selecting “Freeze to Column”.
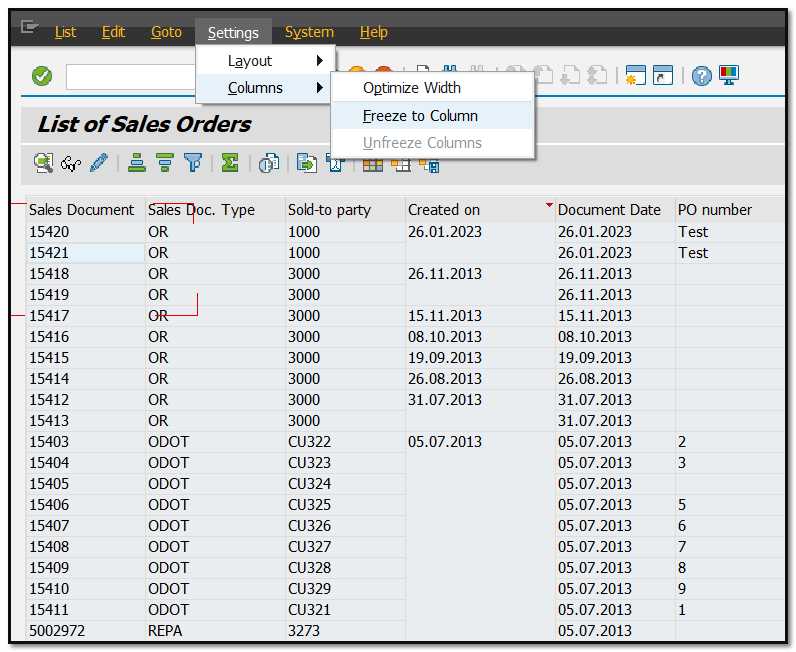
Figure 14 Report Output – Freezing Report Columns
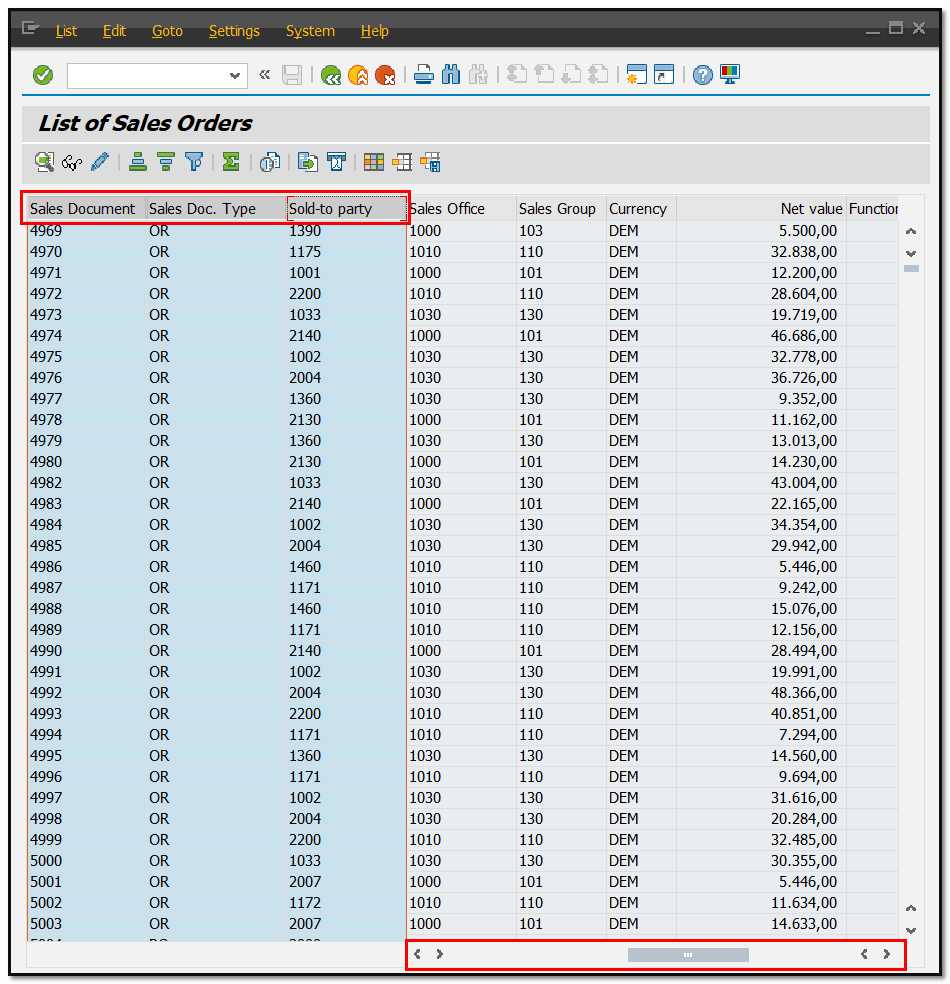
Figure 15 Report Output – Freeze Pane in Report
Export
From the report you can easily save the data to your personal hard drive. To export click List → Export → Spreadsheet.
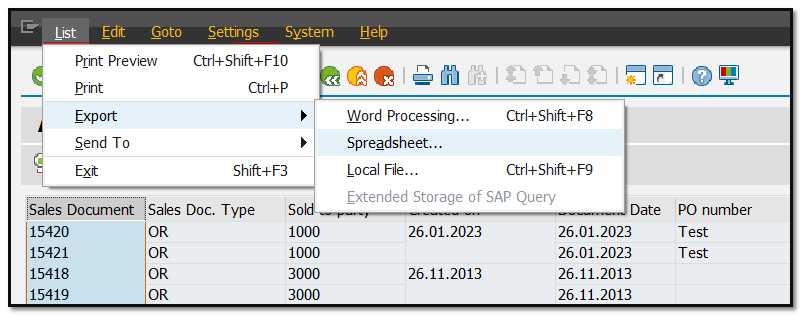
Figure 16 Report Output – Export Data
Choose the preferred Format and click Enter. Select the destination and save the file.
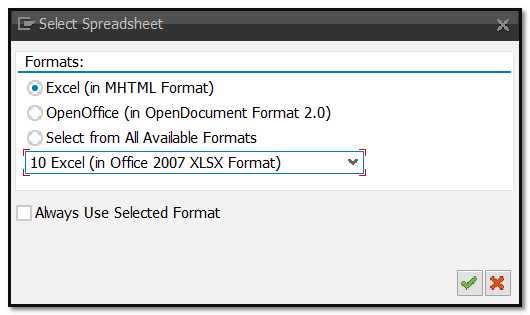
Figure 17 Report Output – Export Data – Spreadsheet Format

